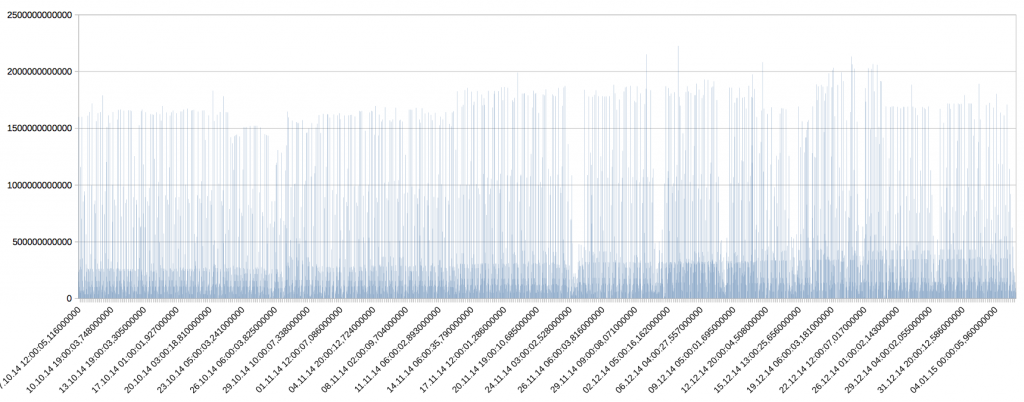
Sometimes, we get statements to look at, and are told “it’s getting worse and worse”. Since DBAs are well advised not to take anything for granted and only to believe what they see with own eyes, here comes a SQL on AWR to see Buffer Gets per Minute, over time.
select s.BEGIN_INTERVAL_TIME,
 round(t.BUFFER_GETS_DELTA/
 0.0001+
 (extract (day from (s.END_INTERVAL_TIME-s.BEGIN_INTERVAL_TIME))*24*60)+
 (extract (HOUR from (s.END_INTERVAL_TIME-s.BEGIN_INTERVAL_TIME))*60)+
 (extract (MINUTE from (s.END_INTERVAL_TIME-s.BEGIN_INTERVAL_TIME)))+
 (extract (SECOND from (s.END_INTERVAL_TIME-s.BEGIN_INTERVAL_TIME))/60)
 ,0) as BG_PER_MINUTE
from dba_hist_sqlstat t,
 dba_hist_snapshot s
where t.snap_id = s.snap_id
 and t.dbid = s.dbid
 and t.instance_number = s.instance_number
 and t.SQL_ID='vwxyz'
 and s.begin_interval_time between sysdate-90 and sysdate
order by t.SNAP_ID
;
Pseudocode explanation:
Get all SQL ID’s from the historical SQL STAT view. Refer it to the snapshot details to get real-world date/time of the events. Since nobody knows how long the AWR snapshot interval was at the time of interest, make BUFFER GETS relative per minute by dividing each BUFFER GETS DELTA by the length of its interval.
Configure the SQL_ID and the interval to be reviewed in WHERE.
You can create a chart like that when exporting the result to the spreadsheet software of your choice:
Basically, this concept will also work with all other columns available in dba_hist_sqlstat, such as CPU consumption, Interconnect load, Disk IO etc.
“Everybody lies”, says Dr. House 🙂
Martin
PS: Please keep in mind, the system(s) to run this query on, will need Oracle’s Diagnostics Pack licensed on top of Enterprise Edition.


